Decode information from each of the following station models:

Sea-level pressure ___________
Temperature ___________
Dew-point temperature ___________
Sky coverage ___________

Current weather ___________
Sea-level pressure ___________
Temperature ___________
Dew-point temperature ___________
Sky coverage ___________
Wind speed ___________
Wind direction ___________
Pressure change during last three hours ___________
Pressure tendency ___________

Sea-level pressure ___________
Temperature ___________
Dew-point temperature ___________
Sky coverage ___________
(a)
Decode information from each of the following station models:
Answer to Problem 1E
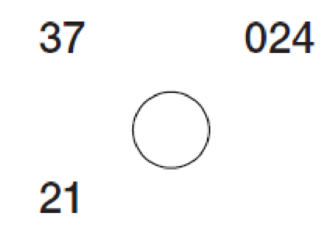
Sea-level pressure 1002.4 mb
Temperature 37⁰ F
Dew-point temperature 21⁰ F
Sky coverage CLEAR
Explanation of Solution
The given diagram represents an area with sea-level pressure 1002.4 mb. Temperature 37⁰ F, dew-point temperature with clear sky coverage. Values are identified using reference symbols given in the weather map lab analysis material.
(b)
Decode information from each of the following station models:
Answer to Problem 1E
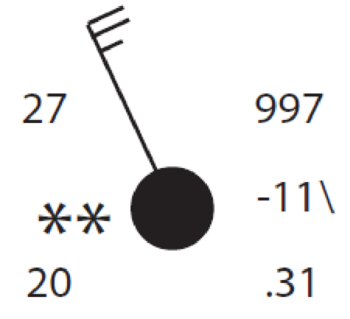
Current weather CONTINUOUS LIGHT SNOW
Sea-level pressure 999.7 mb
Temperature 27⁰ F
Dew-point temperature 20⁰ F
Sky coverage OVERCAST
Wind speed 23-27 KNOTS
Wind direction NORTH WEST
Pressure change
during last three hours 1.1 mb
Pressure tendency FALLING
Explanation of Solution
The given diagram represents an area with sea-level pressure 999.7 mb. Temperature 27⁰ F, dew-point temperature 20⁰ F with cloudy sky. The current weather of the area is continuous light snow. This weather represents a dry, windy conditions of the area because of high wind, low temperature and dew point temperature. Chances of rain are expected due to falling pressure. Values are identified using reference symbols given in the weather map lab analysis material.
(c)
Decode information from each of the following station models:
Answer to Problem 1E
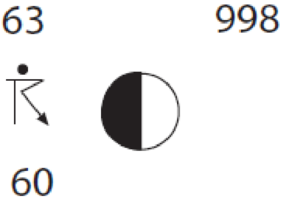
Sea-level pressure 999.8 mb
Temperature 63⁰ F
Dew-point temperature 60⁰ F
Sky coverage PARTLY CLOUDY
Current weather THUNDER WITH LIGHT RAIN
Explanation of Solution
The given diagram represents an area with sea-level pressure 999.8 mb. Temperature 63⁰ F, dew-point temperature 60⁰ F with partly cloudy sky. The current weather of the area is light rain with thunderstorms. Values are identified using reference symbols given in the weather map lab analysis material.
Want to see more full solutions like this?
Chapter 9 Solutions
Exercises for Weather & Climate (9th Edition)
Additional Science Textbook Solutions
Applications and Investigations in Earth Science (9th Edition)
Applications and Investigations in Earth Science (8th Edition)
Conceptual Integrated Science
CHEMISTRY-TEXT
Physics for Scientists and Engineers
Laboratory Experiments in Microbiology (11th Edition)


